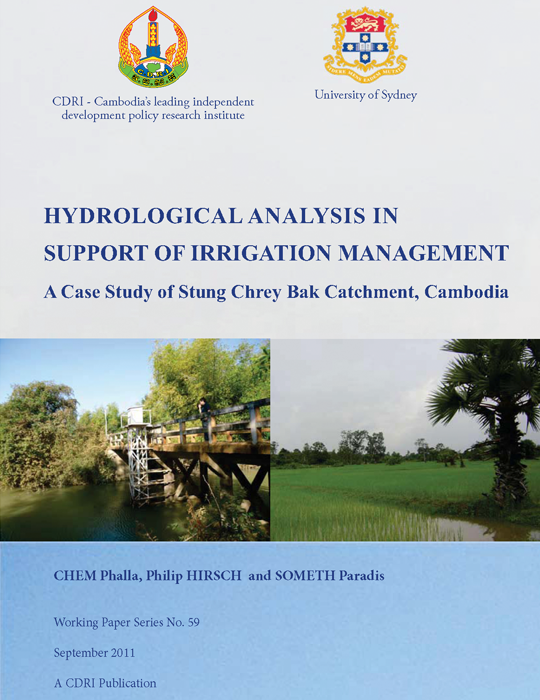
Hydrological Analysis in Support of Irrigation Management: A Case Study of Stung Chrey Bak Catchment, Cambodia
Abstract/Summary
This study examines the possibility of supporting improved
catchment irrigation management by evaluating scenarios based on sound
hydrological analysis using the Water Evaluation and Planning System (WEAP).
The scenarios identify clear options and practical implications for irrigation
management which can inform policymakers and relevant stakeholders. These
stakeholders include the Farmer Water User Communities (FWUCs), commune
councils (CCs), and the Provincial Departments of Water Resources and
Meteorology (PDOWRAM) who are currently in charge of irrigation management at
community and provincial levels.
Contemporary changes in farming practices in Stung Chrey Bak
catchment form the background to this study. Rice farming is changing rapidly
from rain-fed mono-cropping to irrigated double or triple cropping. Seven
irrigation schemes have been built to extract water from the stream so that the
rice growing area of 10,367 ha (741 ha in the dry season) is no longer heavily
dependent on rainfall. Dry season rice is grown mainly in the downstream area
of the catchment where cultivation depends entirely on irrigated dry season
farming because flooding during the wet season, and hence farmers here are
entirely depend on dry season stream flow. Water shortages have led to some
rice growing areas being damaged, and competition between water users in
downstream irrigation schemes has been particularly intense in recent years, especially
in the months of February and March. The rapidly growing demand for irrigation has
created and intensified competition for water resources, raising concern about
the equity of water allocation, sustainability of water usage, social friction
among water-user communities, and long term sustainability of water resources
and environmental impact of irrigation. In addition, traditional supply-based
water planning is no longer appropriate. Instead, planning for water-supply
projects should also focus on demand-side water management.
Government policy reform, including river basin management, is
expected to address some of these concerns. However, sound water management
requires good knowledge and applicable tools to support well informed
decision-making.
The WEAP model incorporates the values of demand management into a
practical applicable water resource planning tool for: (1) defining modelling
problems; (2) establishing the current account, from which different irrigation
demand management scenarios can be evaluated; (3) simulating scenarios; and (4)
evaluating these scenarios against criteria such as water availability and
environmental in-stream flow (e-flow) conditions.
Three demand management scenarios were developed for this study –
reference, 5 percent annual increase in irrigation demand, and additional
reservoir storage from scheme numbered 5. E-flow demand was estimated to be 30
percent of monthly stream flow. The e-flow demand was not included in the
current account (2007). However, it is included in the three scenarios.
In 2007, stream flow was calculated at 289 million m3 and the
irrigated area was 10,367 ha. The lowest flow measured in the middle part of
Stung Chrey Bak catchment was 4 million m3 in March, 5.6 million m3 in
February, and 12.9 million m3 in June.
The reference scenario simulation shows that this stream flow,
without allowing for e-flow, is sufficient for irrigating a dry season rice
growing area of 741 ha and wet season area of 9,626 ha. However, the
catchment’s water supply is not sufficient when the e-flow, water use by other
sectors, livestock, and small rural industrial consumption, which are not
included in this study, are taken into account. There is an unmet demand
of 4.2 million m3, mostly in June (0.95 million m3 in March).
The 5 percent annual increase in irrigation demand simulation
shows that the irrigated area will have reached 16,083 ha by 2016. This would
have two implications: (1) without considering e-flow, climate variability and
other water usages, unmet irrigation demand will be 2.97 million m3 mainly in
June; (2) allowing for e-flow would increase unmet irrigation demand to 7.89
million m3, mostly in June (1.3 million m3 in March).
The additional reservoir storage scenario simulation shows that
the reservoir capacity in irrigation scheme numbered 5 is small and can barely
help improve unmet demand in times of drought. There are topographical and land
acquisition constraints that reservoir storage cannot be enlarged.
Three patterns of stream flows were observed: dry season (November-April), wet season 1 (May-July: low flow) and wet season 2 (August-October: high flow). The variations of stream flow have implicated greatly on farming and ecosystem; i.e. low stream flow in March and June limits farmers from increasing their irrigating areas, and it causes environment degradation. The conclusion is that when taking into account the e-flow demand the irrigated area should be limited to 10,000 ha, including 740 ha in the dry season. Alternatively, when the e-flow is considered as a secondary priority; the irrigated area should not be expanded beyond 12,000 ha.
In a situation of water limitation, a harmonising crop planning
between upstream and downstream cropping areas, bases on stream flow patterns,
is crucial in optimising the use of water resources in agriculture. The lowest
stream flow is in March. Water allocation between schemes numbered 5, 6, and 7
are critical because the irrigation demand in that month is peaked. Because the
stream flow decreases from December to March, cropping patterns in schemes numbered
6 can start in an early November and irrigation scheme numbered 7 can start in
mid or late November in order to avoid an overlapping of irrigation peak demand
period.