Working Papers   117

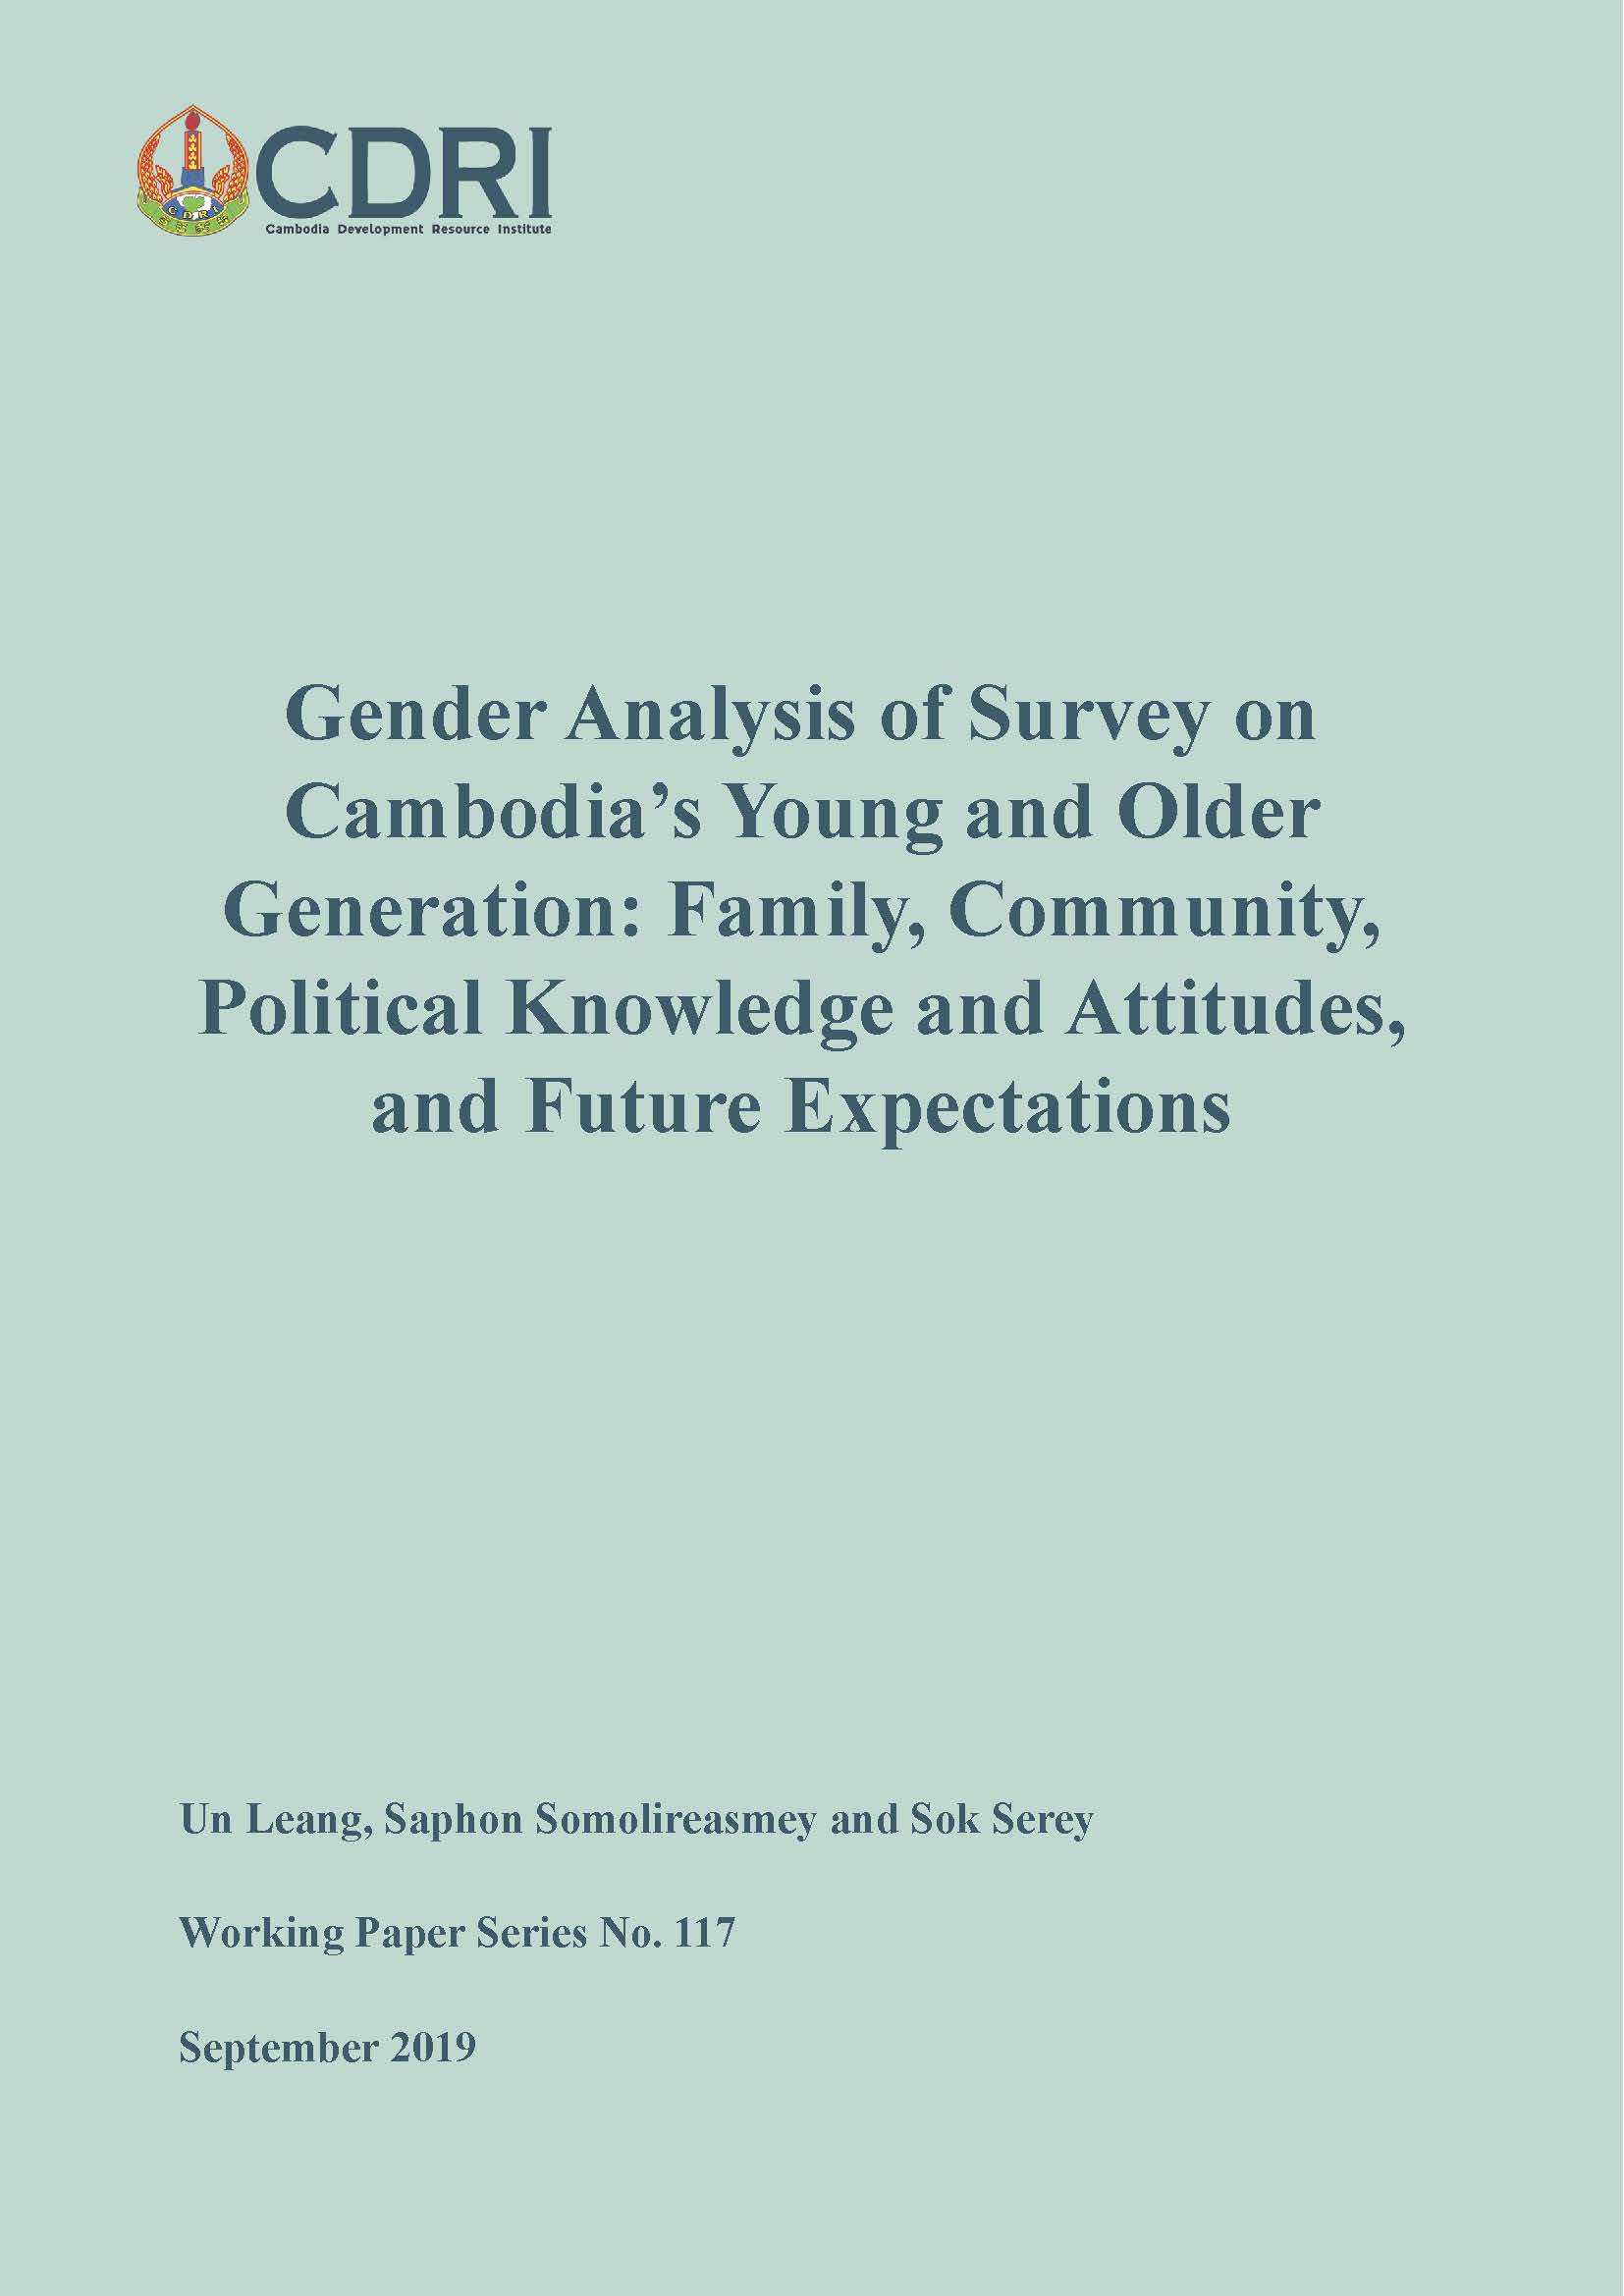
Gender Analysis of Survey on Cambodia’s Young and Older Generation: Family, Community, Political Knowledge and Attitudes, and Future Expectations


Published: 01-Sep-2019
English PDF (77)

Abstract/Summary

Cambodia, following more than two decades of impressive economic performance and development, is fast becoming one of Asia’s new tiger economies. Sustained robust GDP growth of over 7 percent has supported improvements in physical infrastructure (economic and social) and substantial poverty reduction.

This economic improvement, mostly made possible by rapid manufacturing (garment industry), construction and tourism growth, is paving the way for rapid urbanisation. The pace of urbanisation combined with demographic change, improved access to education, and widespread internet use is playing a significant role in shaping and changing perceptions, thoughts and behaviours, especially among women. This report attempts to observe these changes through a gendered analysis of a nationally representative survey, conducted by CDRI from October 2017 to January 2018, of 1,600 Cambodian citizens (aged 16 to 65 years) in 101 (72 rural, 29 urban) villages in five provinces and Phnom Penh (Eng et al. 2019). The survey questionnaire comprised 101 questions covering six sections: demographics, identity and values, trust and respect, outlook, political participation, and media. This report uses the survey responses as its sole primary data and classifies them into four main themes: family, attitudes towards community, political knowledge and attitudes, and future expectations. Each theme is divided into subthemes for detailed analysis, as follows:

  • Family:generational gap, decision making in the family, decision making about marriage.
  • Attitudes towards community: trust and caring about country, community participation.
  • Political knowledge and attitudes: gender perspectives on leadership and social and
  • political participation, concern about social issues and services.
  • Future expectations: the country’s future direction, individuals’ future prospects.

The following techniques and methods were used to analyse the data:

  • Women were not treated as a homogeneous group, but as equipped with seven different attributes: age, place of residence, level of education, marital status, type of employment, employment status, mobility and internet use. The aim was to observe whether or not women with different attributes have different perceptions towards certain issues.
  • For place of residence, the survey question was open, but for this report, responses were categorised into Phnom Penh residents and non-Phnom Penh residents.
  • For level of education, the survey categories were 1) never attended school, 2) primary school, 3) secondary school, 4) high school, 5) vocational training, 6) university (tertiary education), 7) other, 8) no response. This nominal data was changed into basic education or lower, and higher than basic education.1
  • For marital status, the survey categories were 1) single (never been married), 2) married, 3) widow, 4) separated/divorced, 5) no response. These were converted into single and non-single.
  • For type of employment, the survey categories were 1) self-employed (own business), 2) homemaker/family caretaker, 3) working in family business/farm, 4) paid government employee, 5) paid employee for non-profit organisation, 6) paid employee for a private business/for profit, 7) unemployed, 8) student, 9) no response. The report converted these into paid and non-paid employment.
  • For mobility, the survey focused on migration, which was converted into mobility.

SPSS was used for descriptive analysis and crosstab was applied to generate comparative data on the seven selected attributes across the four themes selected for the study. Independent Sample T-Test was applied to compare the mean scores of two independent groups on each variable, data allowing. Crosstabulation generated 567 tables, analysis of which was beyond the scope of this report. The following criteria were therefore used to reduce the number of tables:

  • Relevance of the survey questions to the four themes selected for the study.
    Percentage differences between the responses against each attribute. Data allowing, differences were ascertained with statistical testing; otherwise, a 10 percent difference was used as the threshold.
  • Frequency with which the same or similar questions are raised, discussed and prioritised by government, scholars, research surveys and studies.


Related Publications